User Interface
UI/UX Design and Concepts
- What-you-see-is-what-i-get (wysiwyg)
- Default Tool: Object Select, use the "esc" key
- Clear Selection: "backspace" key
- Selection-Action Paradigm (pick then do)
- Object Transforms according to selection hierarchy; tree, branch and leaf rules of object grouping
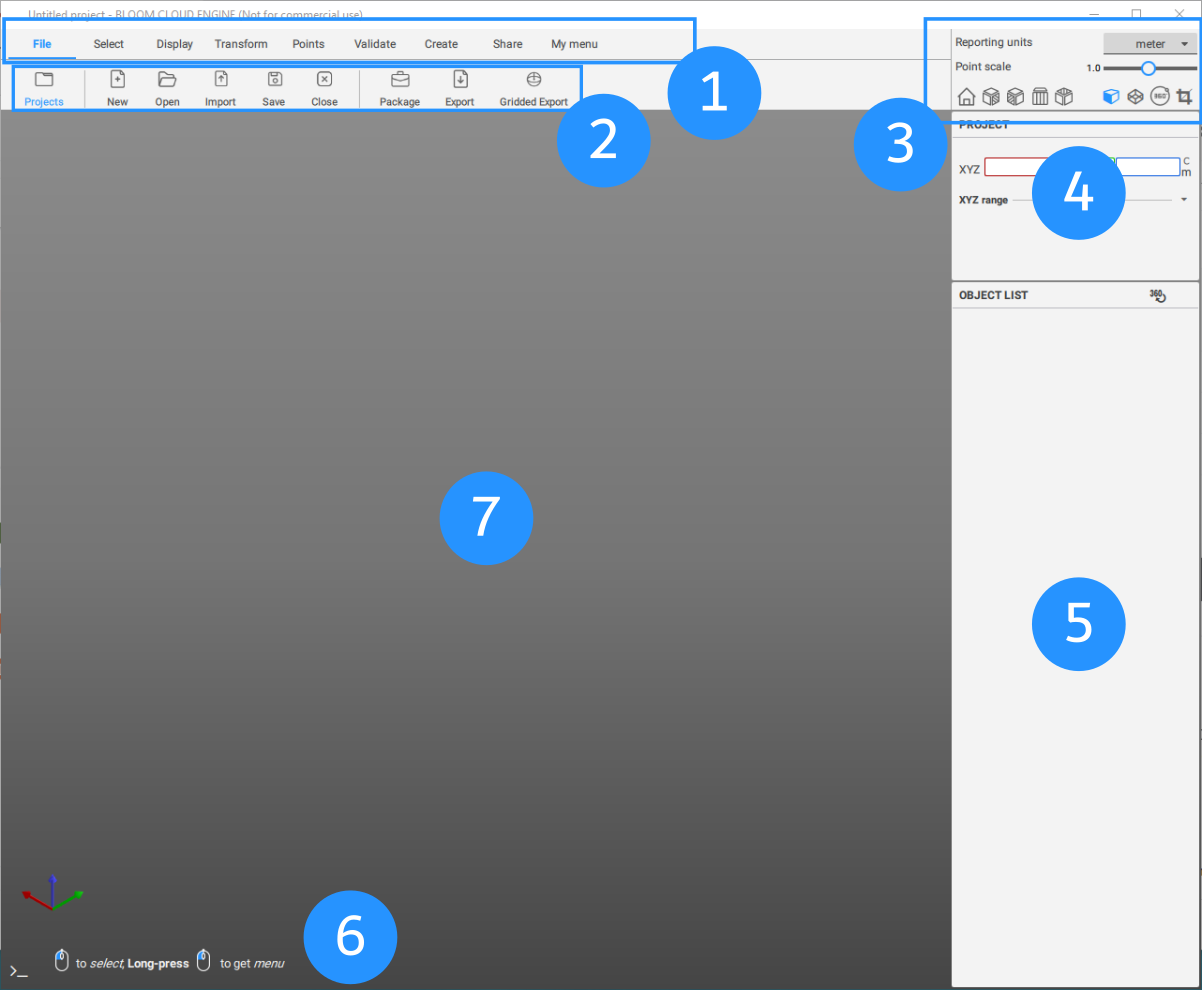
 Tool Ribbon
The Tool Ribbon organizes your tools by common functionality or work process.
 Tool Selection Menu
Select a Tool to perform a function.
 Camera Navigation Panel
|
|
Resets the camera view and camera pivot. |
|
|
Right, Left, Front, Top views |
|
|
Perspective and Orthographic view |
|
|
Panoramic view from scanner center or a marker |
|
|
Clip view to the ModelView created by Model View tool |


 Tool Properties
Shows input parameters to use in tools, a set of computation buttons, followed by results section.
 Object Lister
List Objects within the current project and mange their:
- Object name
- Selection state
- Group hierarchy
- Data type
- Visibility
 Tool Prompt
Provides selection prompts and feedback in the tool.
Navigation & Selection
|
|
Select objects and points. To unselect, use backspace key. |
|
|
Mouse wheel to zoom and press mouse wheel to pan. |
|
|
Rotate view. To set camera rotation pivot, click right mouse button on object. To disable pivot, use |


 Graphics Window
This is where your data model is displayed.

Cycle though terrestial scans, viewing them from the center of the scan. The switch between Points and Image allows to view the scan as points or textured sphere. The view as points is useful to select points and run any operation on selected points, such as, creation of a fitted sphere. Whereas, view as image provide best benefits for placing markers, measurements and sketching lines.
The forward and back buttons, take you to the next or previous scan. In addition, yellow circles in the 3D view denotes the base of other scans. Clicking on these yellow circles, allows you to view scan at that center.
Context menu
Visible all
All nodes under that group node become visible.
Group
Select one or more nodes and use context menu on selected nodes to create a new group node.
Group under
Select one or more nodes and use context menu on any other group node to group the selected nodes under it.
Unload
Pointcloud nodes such as raw scandata and optimized nodes can be unloaded from memory when they are not required, to speed up processing. The data needs to be explicity reloaded to view it again. Please note that visibility is a separate attribute on a node.
Reload
The pointcloud nodes are reloaded at the lowest resolution available.
Invert Selection
Invert selection of nodes, which are under the same group node.
Duplicate
Duplicated nodes are placed under section node SHAPES & OBJECTS
Section Nodes
IMPORTED DATA
All imported data is automatically placed under this group node.
OPTIMIZED DATA
The raw scan data is processed using Details tool and the output is automatically placed here.
More details on Optimized nodes are described here. Same context menu is available for
SHAPES & OBJECTS
Most new objects created by the system are automatically placed here.
PUBLISH DOCS
See object type Publish for more information
MODEL VIEWS
See object type Modelview for more information
ALL MARKERS
Shows each type of marker that is currently in the project. Their visibility can be managed from object lister, to disable export to webview or sending to other systems.
MEASUREMENTS
Created with the Personal Edition of HelpNDoc: Experience the Power and Simplicity of HelpNDoc's User Interface